With the newly released version 6, OfficeReports has added a ‘Link’ menu in PowerPoint, taking linking between Excel and PowerPoint to the next level.

OfficeReports ApS
Copenhagen
Denmark

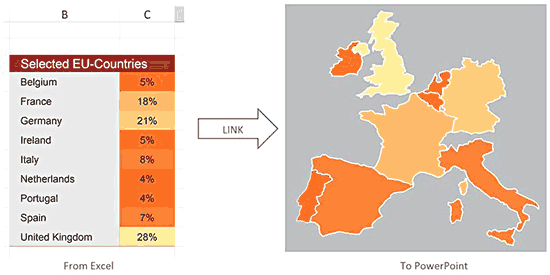
Copenhagen, Denmark: OfficeReports, a reporting tool within the Microsoft Office suite, just released a new version by June 1st, 2016 adding functionality to link data from Excel ranges to PowerPoint tables, charts, and shapes. Compared to other tools solving some of the problems with the linking functionality provided by Microsoft itself, OfficeReports adds some unique functionality: By linking the background colors from Excel, OfficeReports introduces ‘conditional formatting’ for native PowerPoint tables and charts. Specific texts in Excel can be linked as logos in PowerPoint, and specific background colors as icons. Besides linking data to tables and charts, it is also possible to link data to shapes.
Fred Balkenende, Co-Founder and Chief System Architect says: “In almost all cases, the data presented in a PowerPoint presentation originates from an Excel workbook. OfficeReports “Link’ tool introduces a new way for creating advanced PowerPoint infographics.”
Torben Laustsen, CEO of OfficeReports says: “Without having to compromise on the layout, updating monthly reports will only take minutes using OfficeReports. Besides saving time, the automation results in a higher quality due to less human errors.”


OfficeReports is provided as a simple download, adding a ‘Link’ menu to PowerPoint, and an ‘Analytics’ menu to Excel. The presentations and workbooks produced using OfficeReports are just ordinary presentations and workbooks, and can be shared freely with any other Microsoft® Office user.


A short video introduces the new ‘Link’ solution.

More examples in our new blog: OfficeReports Blog
About OfficeReports
OfficeReports provides add-ins for Microsoft Office that simplifies visualization of Excel data in PowerPoint.